Next Level Ruby on Rails Application Monitoring with AppSignal
Full Stack Engineer @ WeTranfer. Ruby on Rails enthusiast. Building beautifully obvious products, and the technology that powers them.
In the first of this two-part series, we covered how to set up AppSignal in a Ruby on Rails application for many great insights out of the box. AppSignal can automatically track errors, monitor performance, and report metrics about some dependencies.
But, in many cases, each of our applications behaves in different ways, so we'll want more than just generic monitoring.
In this post, we will run through adding custom instrumentation and monitoring to a Ruby on Rails application. This will give you deeper insights into how your application is behaving.
Prerequisites if you want to follow along with the code:
An account on www.appsignal.com
Docker installed and running (to use
docker-compose)
To follow along with this post, you will need to set up AppSignal in the sample application with your own AppSignal account.
Custom Instrumentation and Monitoring
When you need more than what AppSignal instruments out of the box, the AppSignal gem allows you to add custom instrumentation to your Rails application.
Instrumenting Parts of the Code
Let's say you want to add a new feature to an application. When a user visits /posts to view all posts, they should be able to filter for posts where the title begins with a specific letter (or something a lot more complex 🪄).
This new search functionality has already been implemented in the Post model with the method Post.where_title_starts_with. Let's update the PostsController#index to use the new method if a specific query parameter is present:
# app/controllers/posts_controller.rb
  def index
    starts_with = params[:starts_with]
    @posts = if starts_with.present?
               Post.where_title_starts_with(starts_with)
             else
               Post.all
             end
  end
This is such a core part of your application that you'll want to know how it performs and when that performance changes. AppSignal provides a few ways to do this.
First, we will instrument the contents of the Post.where_title_starts_with method. If you want to receive insights about any code blocks, you can use instrumentation blocks to wrap the code blocks. Update the method like this:
# app/models/post.rb
def self.where_title_starts_with(letter)
  Appsignal.instrument('Post.where_title_starts_with', "Fetch posts that start with letter") do
    Analytics.track_post_title_search(letter.downcase)
    select('*, pg_sleep(0.01)').where("title ILIKE :letter", letter: "#{letter.downcase}%").load
  end
end
Secondly, we also want to instrument the Analytics.track_post_title_search method being called because app/services/analytics.rb is doing some heavy processing. In this case, we will use method instrumentation to instrument the entire method more accurately:
# app/services/analytics.rb
require 'appsignal/integrations/object'

class Analytics
  def self.track_post_title_search(letter, sleep = sleep(1))
    # Some heavy processing
    sleep 1
  end
  appsignal_instrument_class_method :track_post_title_search
end
Insights
A few minutes after saving the above to the application, take a look at whatever new information is available on your AppSignal dashboard (if you don't see the information, you may need to restart the docker containers again). You can verify that the new feature works by visiting the posts index page with a search param: http://localhost:3000/posts?starts_with=f
Depending on the number of posts created in the database, the /posts endpoint will have become a lot slower.
If you open up performance issues on AppSignal ('Performance' -> 'Issue list') and view the PostsController#index action, lower down on the page, you should be able to see an 'Event Timeline'. This gives you a breakdown of how much time is spent running specific code:
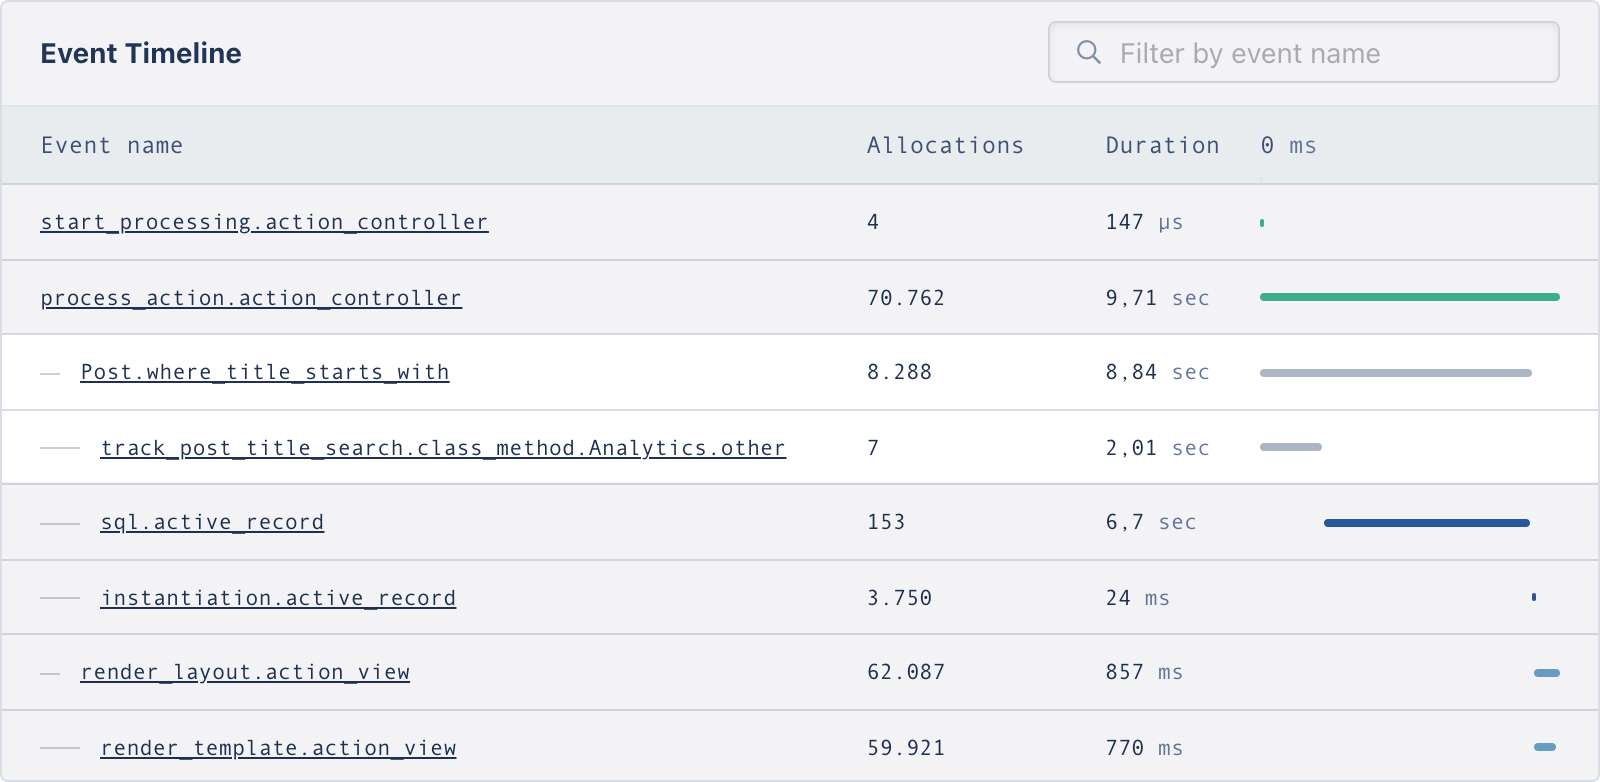
This timeline exists for all performance events, but here, we can also see the custom instrumentation events. It shows us that calling Post.where_title_starts_with took 8.84 seconds to run, with 2.01 seconds used up by the Analytics.track_post_title_search method, and the remaining time used up by an active record query. You can also click into individual events for further investigation and see more information about their performance — e.g. the sql.active_record event.
AppSignal's instrumentation helpers give you a more detailed breakdown of the application code, so it's easier to gain insights into particular pieces of code that you think could impact an application's performance. You can learn more about this in AppSignal's instrumentation guide.
Exception Handling
Besides monitoring the performance of your code, you also need to know when the application doesn't behave as expected and where things go wrong. We've already seen how AppSignal reports exceptions that have not been handled by our code. But there's always a bit more than what comes out of the box.
You can start by removing existing code that causes an intermittent error. We see where this error occurs in the backtrace when viewing the error on the dashboard. Inside of app/controllers/pages_controller.rb remove the if statement:
class PagesController < ApplicationController
  def home
    CreateRandomPostsJob.perform_later
  end
end
Now, in the overview dashboard, the application's error rate will drop significantly.
Currently, when a user tries to view a post that doesn't exist, the application crashes — e.g, http://localhost:3000/posts/doesnotexist. Instead, you might want to show them a message. Add a rescue to where this could happen inside the PostsController. Update the #set_post method:
# app/controllers/posts_controller.rb
class PostsController < ApplicationController
    .
    .
    .
    private
    def set_post
      @post = Post.find(params[:id])
    rescue ActiveRecord::RecordNotFound => e
      render json: { error: "Oops. That post isn't here" } , status: :not_found
    end
    .
    .
end
Because we are manually handling the exception, it won't automatically be reported to AppSignal. You can still track errors manually by using Appsignal.set_error.
The easiest way to track an error is to simply add it as the function's only argument like Appsignal.set_error(e). We also want to take advantage of the ability to add more context to the request. AppSignal allows you to tag events with your own arbitrary information using Appsignal.tag_request:
def set_post
  Appsignal.tag_request(user_id: 'user-from-params', post_id: params[:id])
  @post = Post.find(params[:id])
rescue ActiveRecord::RecordNotFound => e
  Appsignal.set_error(e)
  render json: { error: "Oops. That post isn't here" }, status: :not_found
end
Now visit http://localhost:3000/posts/doesnotexist to verify that you get back the JSON response as expected, instead of having the application crash.
Insights
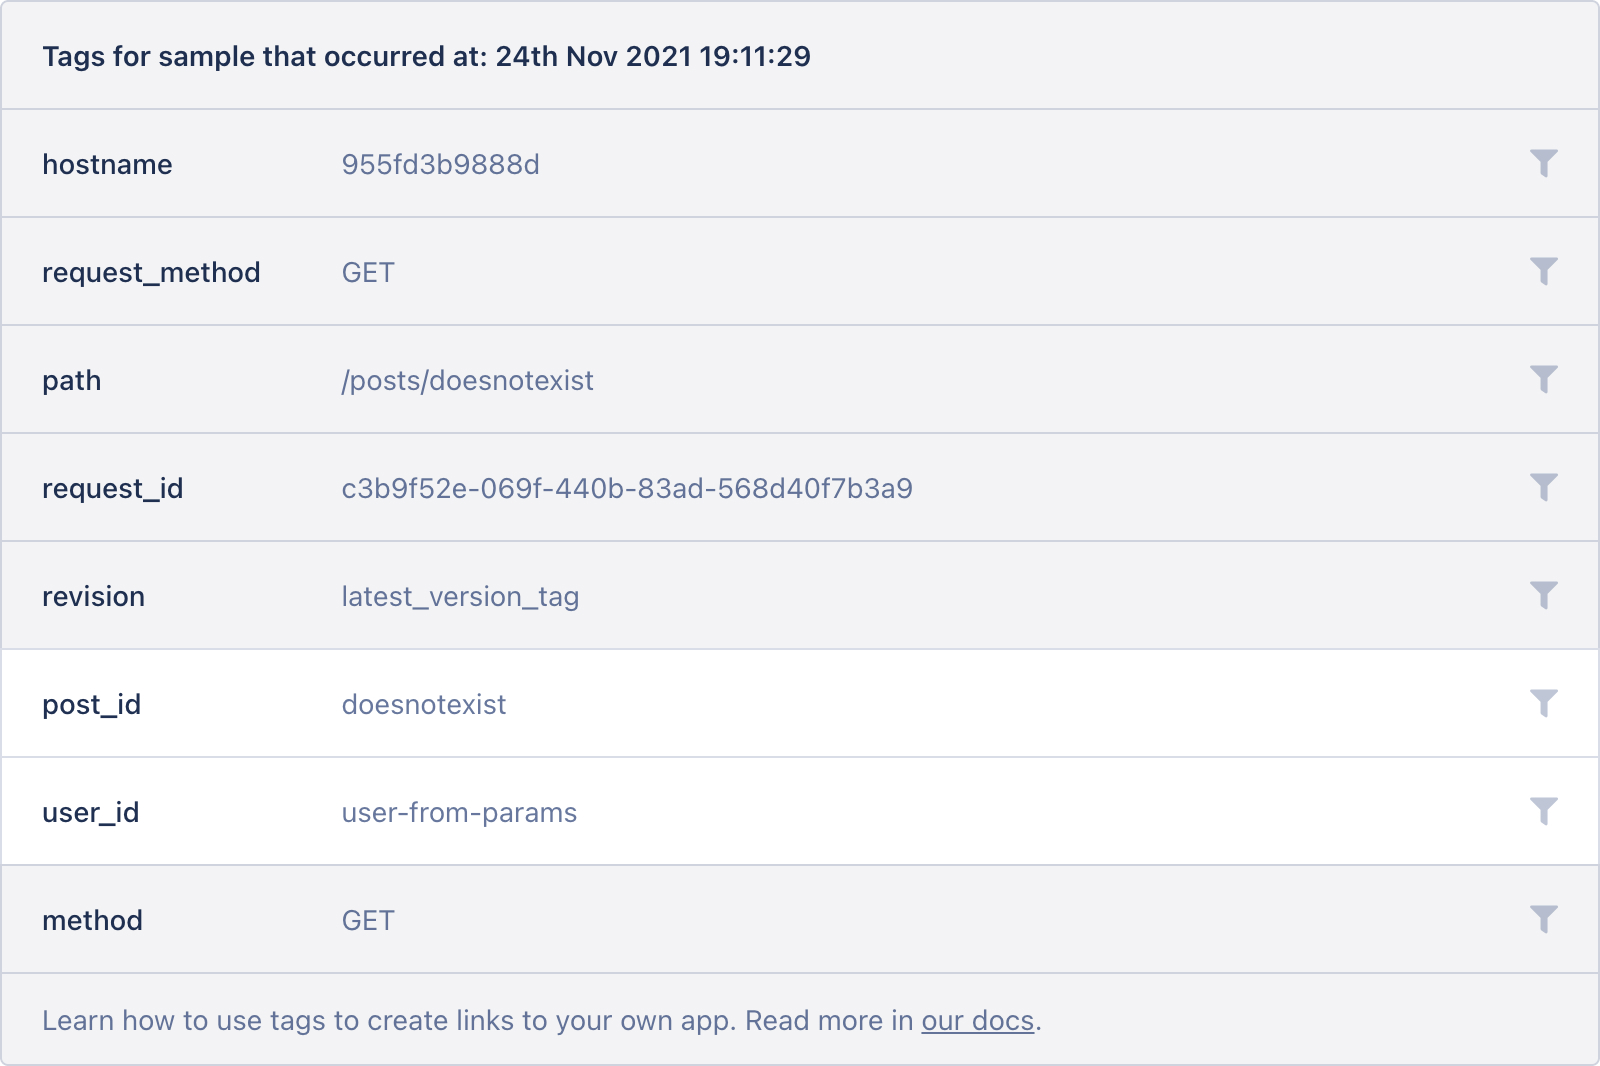
After you try to view a post that does not exist, the added updates ensure that the errors are reported to AppSignal. On the AppSignal dashboard, in 'Errors -> Issue list', find and view the new reported error (ActiveRecord::RecordNotFound).
The error detail page gives us useful context about the error, which by default, includes information about the request such as the HTTP method, parameters, and session data. You can see that the custom tags are also included, which gives you the ability to filter for all of the errors with a matching tag.
Because we tagged the request, it adds this information to errors and other instrumented events. If you view an individual post a few times, e.g., http://localhost:3000/posts/1, you will notice that the tags are also included when you look at the performance measurement ('Performance' -> 'Issue list' -> 'PostsController#show'). You can read more about tagging transactions in the guides.
This ability to add custom metadata to the transaction opens up many opportunities to help diagnose issues in production. A great example of this is adding Kubernetes metadata to your errors.
Metrics
Now that there is some custom instrumentation and error monitoring in place, you might realize that sometimes, there are large spikes in posts searches. Whenever a user searches, Analytics#track_post_title_search is called, which does some calculations and makes an API call to a third-party service. This third party has rate limits on the API. We want to track how often it is called to keep an eye on how close the application is to its limits.
AppSignal allows you to track custom metrics throughout the application as you wish.
First, we will track how often we're calling our analytics service and with what data, using a counter and tags:
#app/services/analytics.rb
require 'appsignal/integrations/object'

class Analytics
  def self.track_post_title_search(letter, sleep = sleep(1))
    Appsignal.increment_counter("track_post_search", 1, { letter: letter })
    # Some heavy processing
    sleep 1
  end
  appsignal_instrument_class_method :track_post_title_search
end
Secondly, we will also track the number of posts being returned in the PostsController#index, because this is a core part of the application's behavior, and we know it keeps growing:
#app/controllers/posts_controller.rb
class PostsController < ApplicationController
    .
    .
  def index
    .
        .
    Appsignal.set_gauge("posts_index", @posts.size, starts_with: params[:starts_with])
  end
end
The fake traffic script still running on the application will generate some data, but to add more variety, let's also search for posts starting with f, l, and v.
Insights
To view the custom metrics, you will need to create a dashboard with custom graphs on AppSignal. This can be done through the UI, but we will just import one for this example. Under the 'Dashboard' section, click on 'Add dashboard' and import a dashboard with the following:
{
  "title": "Post Search",
  "description": "Sample dashboard about posts search activity",
  "visuals": [
    {
      "title": "Analytics",
      "line_label": "%name% %letter%",
      "display": "LINE",
      "format": "number",
      "draw_null_as_zero": true,
      "metrics": [
        {
          "name": "track_post_search",
          "fields": [
            {
              "field": "COUNTER"
            }
          ],
          "tags": [
            {
              "key": "letter",
              "value": "*"
            }
          ]
        }
      ],
      "type": "timeseries"
    },
    {
      "title": "Search",
      "line_label": "%name% %starts_with%",
      "display": "LINE",
      "format": "number",
      "draw_null_as_zero": true,
      "metrics": [
        {
          "name": "posts_index",
          "fields": [
            {
              "field": "GAUGE"
            }
          ],
          "tags": [
            {
              "key": "starts_with",
              "value": "*"
            }
          ]
        }
      ],
      "type": "timeseries"
    }
  ]
}
You should see data on your graphs within a few minutes. Hovering over the lines shows you a legend of the metrics collected within the timeframe you're viewing.
Notice that this shows different lines for each tag value. Currently, our fake traffic is only searching for the letter e, but because we manually searched for other letters, you will see a new line on the graph for each one to indicate another data point.
Thought that was enough? AppSignal has more custom instrumentation solutions to offer that we won't be covering here. One that's worth a quick mention is breadcrumbs. Breadcrumbs allow you to track a list of actions in your application, which will then be reported in an error. You'll have even more specific and ordered information about what led up to an error.
Read all about custom instrumentation in the guides.
Wrap-up: Custom Instrumentation and Monitoring for Ruby Apps with AppSignal
Part 1 of this series covered the basic setup and use of AppSignal for your Ruby applications.
In this part, we've taken an application that already has great out-of-the-box monitoring and made it even better using the AppSignal gem.
AppSignal's custom instrumentation, error tracking, and performance monitoring features give you the insights you need into how your applications are behaving. It gives your application a lot out of the box while letting you take control when needed.
It's time to let your code run free in the wild, as long as you keep an eye on how it's doing. Happy coding!